Customer Obsession Leads to Better Conversion Rate Optimization
Author & Editor
Founder & CEO
Published on: Nov 9, 2023 Updated on: May 22, 2024
Table of Contents
Do you understand your customers well enough to be able to do conversion rate optimization correctly?
More to the point: Are your processes for understanding your consumers sound enough to help you strategize for conversion rate optimization (CRO) effectively?
A structured process for consumer behavior insight development. As an established conversion rate optimization agency, that is one of the main reasons businesses come to us seeking help. Because we get it: There’s a ton of data out there; you may have the tools to gather them, but knowing what data to siphon out and process into insights is where you can get many things wrong.
But in today’s digital marketing landscape, there’s just no overstating the value of developing accurate insights and, hence, why you need conversion rate optimization. As an effective conversion optimization strategy is always hinged on accurate consumer insights, it is critical to avoid costly campaigns and, most of all, to deliver value for your stakeholders.
So, if you have the tools and the data but lack the process for accurate insight development, then allow us to give you one through our tips further down. Below, we’ll delve into a structured process for developing these essential consumer behavior insights, providing you with the skills to map out an accurate, insight-driven conversion optimization strategy.
First, let’s tackle online user behavior.
Types of user behavior you observe online
If you understand what is conversion optimization, then you know well that it is a practice of online marketing that is heavily invested in learning about (and even predicting) consumer behavior. Therefore, an understanding of what consumer behavior is and the many ways it manifests online is integral to getting your CRO strategies right. And there are a number of them.
READ ALSO: Customer Insights Analysis – What is it and its Strategic Uses?
Here are some of the most common user behaviors we look into whenever we’re doing our customer and market research (more on this later) before developing CRO strategies:
1. Browsing behavior
Sometimes, we open a website without looking to fulfill a specific purchase intent. Any and all interactions that happen in this way on websites and/or other platforms are what we mean by browsing behavior.
At times, it can involve like clicking and reading a few pages, reading through content, and spending just spending time idly on the site. Some tools we use to analyze this for websites are heat maps that display data on hot spots and cold or dead zones on your pages.
From this visual representation of browsing behavior alone, you can already glean insights into what your customers are thinking. Like cold or dead zones, for instance. These typically signal that a feature you put on your website is not interesting or helpful to your audiences.
Our tip: Dig deeper into possible reasons as to why or why not a specific region or point in your page is performing. Do this with the help of Google Analytics 4 (GA4) which can give you more data on important events and interests of your audiences and/or customers.
2. Search behavior
Is how users leverage search functions on platforms and/or external search engines to find specific information or products on a website. This covers keywords or keyphrases they use to run queries, search filters, and pages they land on after a search.
Analyzing this is important not just for boosting the visibility of (say a blog or a transactional page). It’s just as important for:
- improving the search functionality of your website and thereby ensuring that visitors find what they’re looking for;
- gaining insights on the interest points of your audiences at large, and;
- optimizing content relevance through timely updates.
Analyzing this doesn’t take sophisticated tools. To better understand what keywords your website and pages are mostly associated with, we recommend using Google Search Console. On the other hand, Ahrefs is a great tool for understanding keyword usage in the industry and consumer market you’re targeting.
3. Buying behavior
This represents the actions taken by users when making a purchase. It includes purchase-specific events such as:
- adding items to the cart;
- proceeding to checkout, and;
- completing the purchase.
Along with abandonment behavior, this is one of the most critical user behaviors to analyze for conversion optimization. Looking at the data side by side will help you improve conversions in the best way possible.
In the case of buying behavior, this consumer behavior can give you insights specifically for improving key conversion points. This can be anything from payment options (is it safe to provide payment details?) to flexibility of payment (can I have the freedom to choose how I pay for my purchase?).
4. Abandonment behavior
Refers to the abandoning actions or processes done by a visitor. In short, this is when your audiences don’t complete a purchase (ie. leaving items in the shopping cart without completing a payment) or a form submission. Analyzing this is vital to identifying friction points during transactions that you may not be aware of and, subsequently, seek to resolve.
For instance, a form may be deemed to be asking for too tedious or jarring to fill out, hence a customer abandoning the submission. Another reason could be that you failed at establishing trust, or an error occurred midway through the transaction.
If you’re looking for quick and effective wins in CO, then identifying patterns in abandonment behavior and optimizing to address these issues is the place to start. This is because customers who abandon carts are, for whatever reason, already interested in your product. The only thing left for you to do is to determine and address the issue that may have led to abandonment.
Process for analyzing user behavior
Now that you’ve familiarized yourself with the different behaviors that users demonstrate online, it’s time to work your way toward accurate consumer behavior insight development.
Phase 1: Collecting and interpreting user data.
The first phase you must go through is focused on data collection. Here, as you may have guessed, your attention and focus are directed to collecting every kind of information you need.
However, that’s not to say that you can and should collect every piece of information you can. Just because you can do it, doesn’t mean you should, after all. With mounting distrust toward online operators, protecting customer data privacy online is now more urgent than ever.
Take that as a note of warning and allow it to guide you as you follow the procedure below.
a. Define your objectives.
Everything starts with a SMART goal, especially in conversion optimization. As it deals with marketing experimentation, goals and objectives are important for clearly defining the bounds for testing; this is to avoid muddling your data.
Ask yourself: What specific consumer behaviors do you want to understand and optimize for? Is it reducing cart abandonment? Or improving the sign-ups for your newsletters? Whatever it may be, clearly defined objectives help you determine what tools and techniques you need to move along.
b. Identify data sources.
After defining your objectives, your next step is pinning down your data sources. Alignment with your goal and data sources is important as you might end up looking at the wrong data and form inaccurate insights later on; be vigilant and meticulous.
So, let’s say we do want to improve newsletter sign-ups. What data sources can you look at for this? How do you gather both qualitative and quantitative data?
For our example, quantitative data for newsletter sign-ups can be measured with GA4 with events tracking set up for tracking newsletter opt-ins. Below is a video that demonstrates how to do it:
On the other hand, qualitative data can be in the form of surveys made with Hotjar, or even a simple Google Form that your audiences can fill up. It’s always best to get both quantitative and qualitative data so that you can paint a detailed picture of the behaviors of your target audience. For more tools you can use, you can check out our article which compiles all of our recommended conversion optimization tools.
After you’ve established which tools you’ll be using, your next step is to ensure that all data tracking and attribution models are functioning soundly. If you’re unsure of how to go about this, you can always ask the help of data analytics experts to consult with and/or accomplish this for you.
c. Segment your audiences.
This is where you divide and categorize your user base into groups based on specific identifiers. These identifiers can be demographics, interest affinities, and even device usage. Doing this allows you to develop hyper-specific and targeted insights.
In our newsletter sign-up example, you can do this by segmenting your target audience based on the type of visitor they are. With your GA4, you can further identify whether those who abandon newsletter sign-up forms are returning visitors or new visitors.
This then tells you that perhaps, a specific type of visitor is more interested in your newsletter than the other. If so, then it could be beneficial to focus your optimization efforts on creating more buy-in for the less interested group.
d. Collect your data.
Once you’re all set on three previous steps, it’s time to collect your data. That’s straightforward enough as modern tools can be left alone to gather the necessary information.
The more important point we have to note here, however, is the specific metrics and KPIs you should be monitoring. In that regard, make sure that the KPIs and metrics you track are in absolute alignment with your goals and objectives.
For our newsletter sign-up example, the metric here, of course, is the quantity of newsletter sign-ups. And qualitative data you can look into can address the newsletter content itself, or the functionality of the sign-up form. It is important to keep this focus when looking at your data tracking tools as it’s easy to become inundated with the information coming in. If you’re not careful, overanalyzing all the data could lead to inaction.
With that, we go into phase two of the consumer behavior insight development process.
Phase 2: Analyzing and distilling the data into actionable insights.
This next is where it gets exciting. Many of you know that data and actionable insights from it are the cornerstones of informed decision-making for businesses. And it’s a non-negotiable in today’s digital landscape.
From these insights are birthed tailored strategies, products, and services that lead to customer satisfaction. It also enables you to maximize growth opportunities while minimizing risks. More importantly, as we move towards a marketing experimentation revolution, this is an important stepping stone to accelerating business growth.
Let’s begin.
a. Funnel analysis
Amplitude defines this as a method of analyzing the sequence of events leading up to a point of conversion. It is used to identify points in the conversion funnel where users tend to drop off. Similarly, it is used to identify bottlenecks in your conversion funnel.
To conversion optimizers, this information is vital to understanding what friction points your business needs to relieve so that you can, in turn, reduce cart and/or form abandonment. This helps you sleuth out what you can optimize in your existing infrastructure and/or campaigns.
Some tools that are helpful for this type of analysis include:
- Google Analytics
- Amplitude
- Mixpanel, and;
- Heap
b. Time-based analysis
This is another useful method for analyzing data as it lets you identify user behavior trends over time. It can show you seasonality patterns, weekly or daily peeks, and even external influences that shift consumer behavior.
The best example of the value of time-based analysis is demonstrated by the way online trends cause spikes in searches. Remember what the Netflix show ‘Queen’s Gambit’ did to chess set sales in 2020? They created demand both in offline sales and online interest.
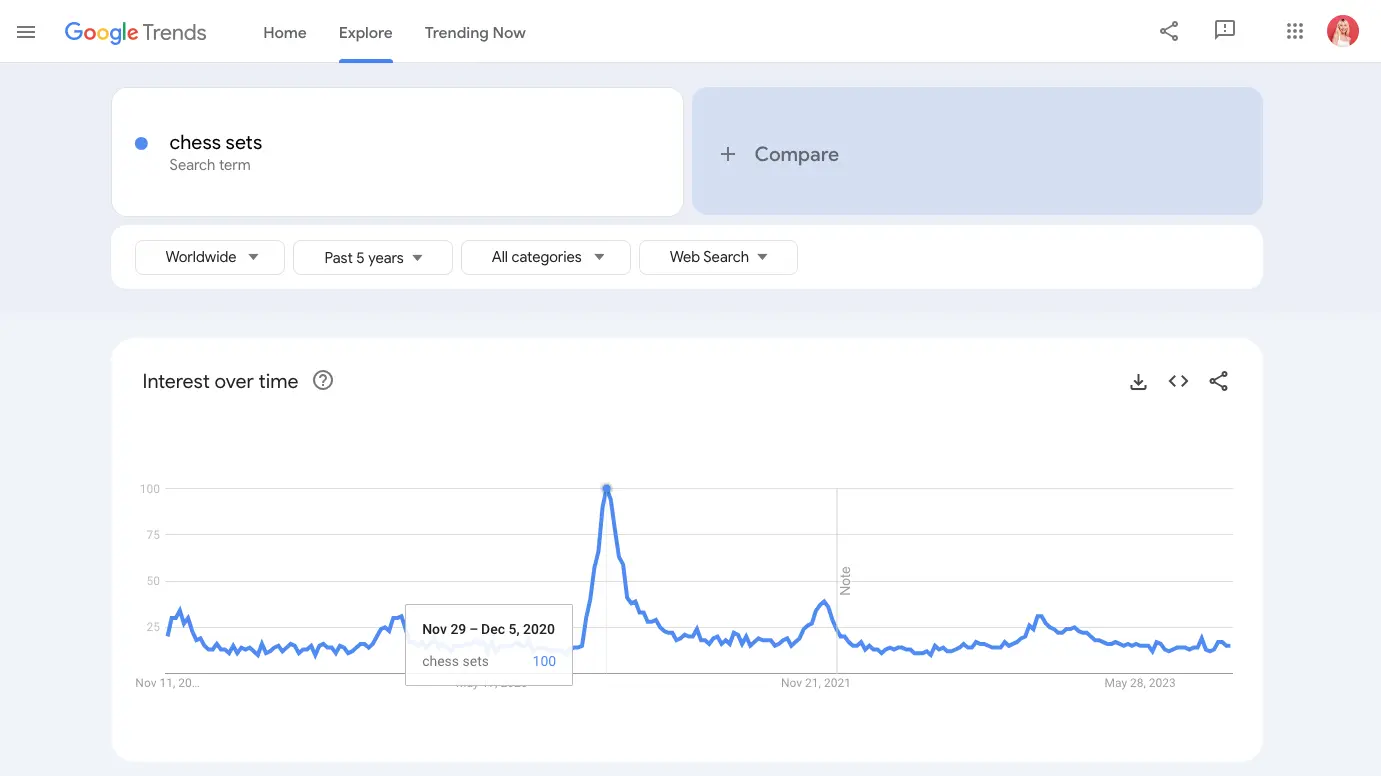
Apply the same logic to your product and/or service pages and you may notice the same patterns. Does a specific product perform better in the fall versus in the spring? After answering that, you can then branch your research out into what possible benefits it could provide in the specific season. Or, perhaps look into external influences that could have contributed to the spike (or drop) in performance.
c. Analyzing cross-device behavior
The fact that smartphone usage has ultimately changed browsing behavior underscores the importance of this analysis. While the global majority prefers mobile devices when browsing, the same can’t be said about conversions.
Data from Webfx reveals that desktops convert at around 3.82% versus mobile devices which convert at just 1.32%, globally. This discrepancy between mobile browsing and conversions, they explain further, could be correlated with screen size; but further qualitative investigations on roadblocks to mobile conversions are needed to validate this.
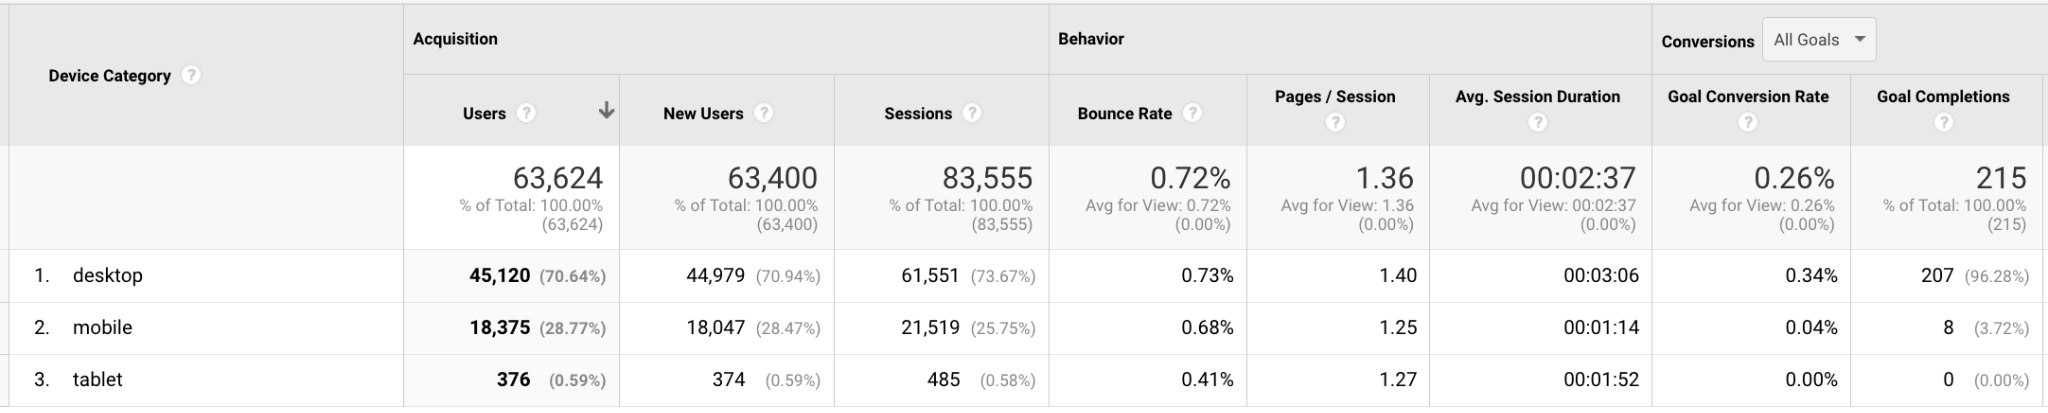
When doing this analysis, remember to take note of conversions coming in from various devices. Are your conversions coming mostly from desktop, tablet, or mobile users? Even if tablet and desktop users don’t convert as much as mobile users, what insight can you derive from those who do?
The answers to these questions can help you uncover a new or less-explored path to conversion that you can potentially leverage.
d. Content analysis
Content is designed and produced to capture your audience's attention. Be they new or returning users, your content is what reels audiences into your website, and it’s vital to pull in a steady stream of leads that you can turn into customers.
READ ALSO: How to Use Lead Management to Improve Your Conversions
Hence, a content analysis is done to understand the interests and motivations that keep your audiences engaged. It’s important to conduct this evaluation as it helps you capture new audiences and recapture users who have disengaged from your business.
A content analysis helps you answer interest-related consumer patterns like:
- Does long-form content work better at getting newsletter sign-ups?
- Which specific blog topics are helping pull in leads?
- What other offshoot topics could they be interested in?
Uncovering the answers to these will help you adjust your content marketing and search engine optimization strategies accordingly.
e. Customer journey mapping
Through your data collection and analysis, you should have already painted a better picture of your customers. You know who they are and you have an idea of their motivations and pain points. We can now write your customer’s story in what we call customer journey mapping.
In this final step, you are writing the narrative of your hero (the customer) and laying down the story of how they arrived at a resolution of their pain points. This map is a visual representation of the complete user experience you’d like to optimize for and hence, serves as a blueprint for your conversion efforts.
When developing a customer journey map, don’t neglect the importance of personalization. You have the data already, anyway. Now, you just need to make sure that your executions are in alignment with their behavior so that all hurdles to conversions are eliminated and all motivations are satisfied.
Five ways to leverage your insights for conversion optimization
We’re sure that with the user behavior insight development process we’ve just given you, you’ll form a million different opinions about how you can improve your conversion rates. But hold your horses; you can’t do everything, everywhere, all at once.
Try to start small so that you can build a practice first and then, scale up from what foundation you’ve solidified. Here are some areas where you can get quick wins.
- Tailoring landing pages to match user intent and behavior. Align landing pages and their content to specific user intentions so that they find your website quickly and easily. This strategy improves page relevance to search, effectively optimizing your website for conversions and search engines.
- Streamlining the checkout process for higher conversion rates. Simplify your checkout process. Don’t give people time to think or get distracted by reducing steps through auto-fill functionalities, or making sure that there are no links leading out of the checkout page.
- Implementing personalized product recommendations based on browsing history. This will improve the user experience and keep them engaged thereby increasing conversions.
- Optimizing website speed and performance to reduce bounce rates. If you don’t optimize for this first, then it’s quite pointless to optimize other areas. Nothing turns away a potential customer more than a slow-loading website, after all.
- Harnessing user feedback and reviews to build trust and credibility. Trust brings in business. On your website, you can best earn trust by including feedback and reviews about your product. These bolster your credibility and improve conversions simultaneously.
Key takeaways
The argument that data is the single most potent fuel that powers businesses is a short-sighted one. Today, everyone has access to data; everyone can gather information about their customers; and it’s easy to claim that you know how to read and analyze that information.
The only true way to get the upper hand in the landscape is to have a process for user behavior insight development. One that you can practice consistently. And, more importantly, one that enables you to form accurate insights.
Given that and everything we’ve discussed thus far, remember that CRO isn’t just about your data-gathering and analysis skills. More importantly, it’s about:
- User-centric strategies. Fickleness and the numerous distractions online have made user attention harder to grab than ever. To make a lasting impression, you must let user-centricity guide everything you do – from the research to your executions for CRO. This not only benefits you and the customer for one transaction but for each one that follows.
- Listen and respond with empathy. This work put into understanding your online users all boils down to an exercise of empathy. Even the most thorough research into user behavior can lead to wrong conclusions if you don’t try to listen with empathy. Similarly, executions that ignore this understanding can also miss the mark and cost you a customer. Always operate with empathy.
- Be wary of your biases. This is one of the most detrimental factors to the quality of your insights. Remember that when you look at data, put your biases aside and take in what it tells you. Your biases could alter the way you interpret and form insights, leading to tone-deaf executions that turn into losses. Remove the bias – there is as much joy in being proven wrong and learning as there is in being right in the first place.
Do you have questions about user behavior insight development that we didn’t address in the content? Make sure to reach out to us and let us know; we’ll gladly answer your questions via call or email or through our Facebook, X, and LinkedIn accounts.
Speaking of email, make sure to subscribe to our newsletter and we’ll deliver more conversion rate optimization tips and strategies straight to your mailbox.